paper-viz

R 科研绘图模板库:按任务找图,复制代码,换上自己的 data.csv。

R figure templates for papers: find a chart, copy the code, swap in your own data.csv.

加载中…

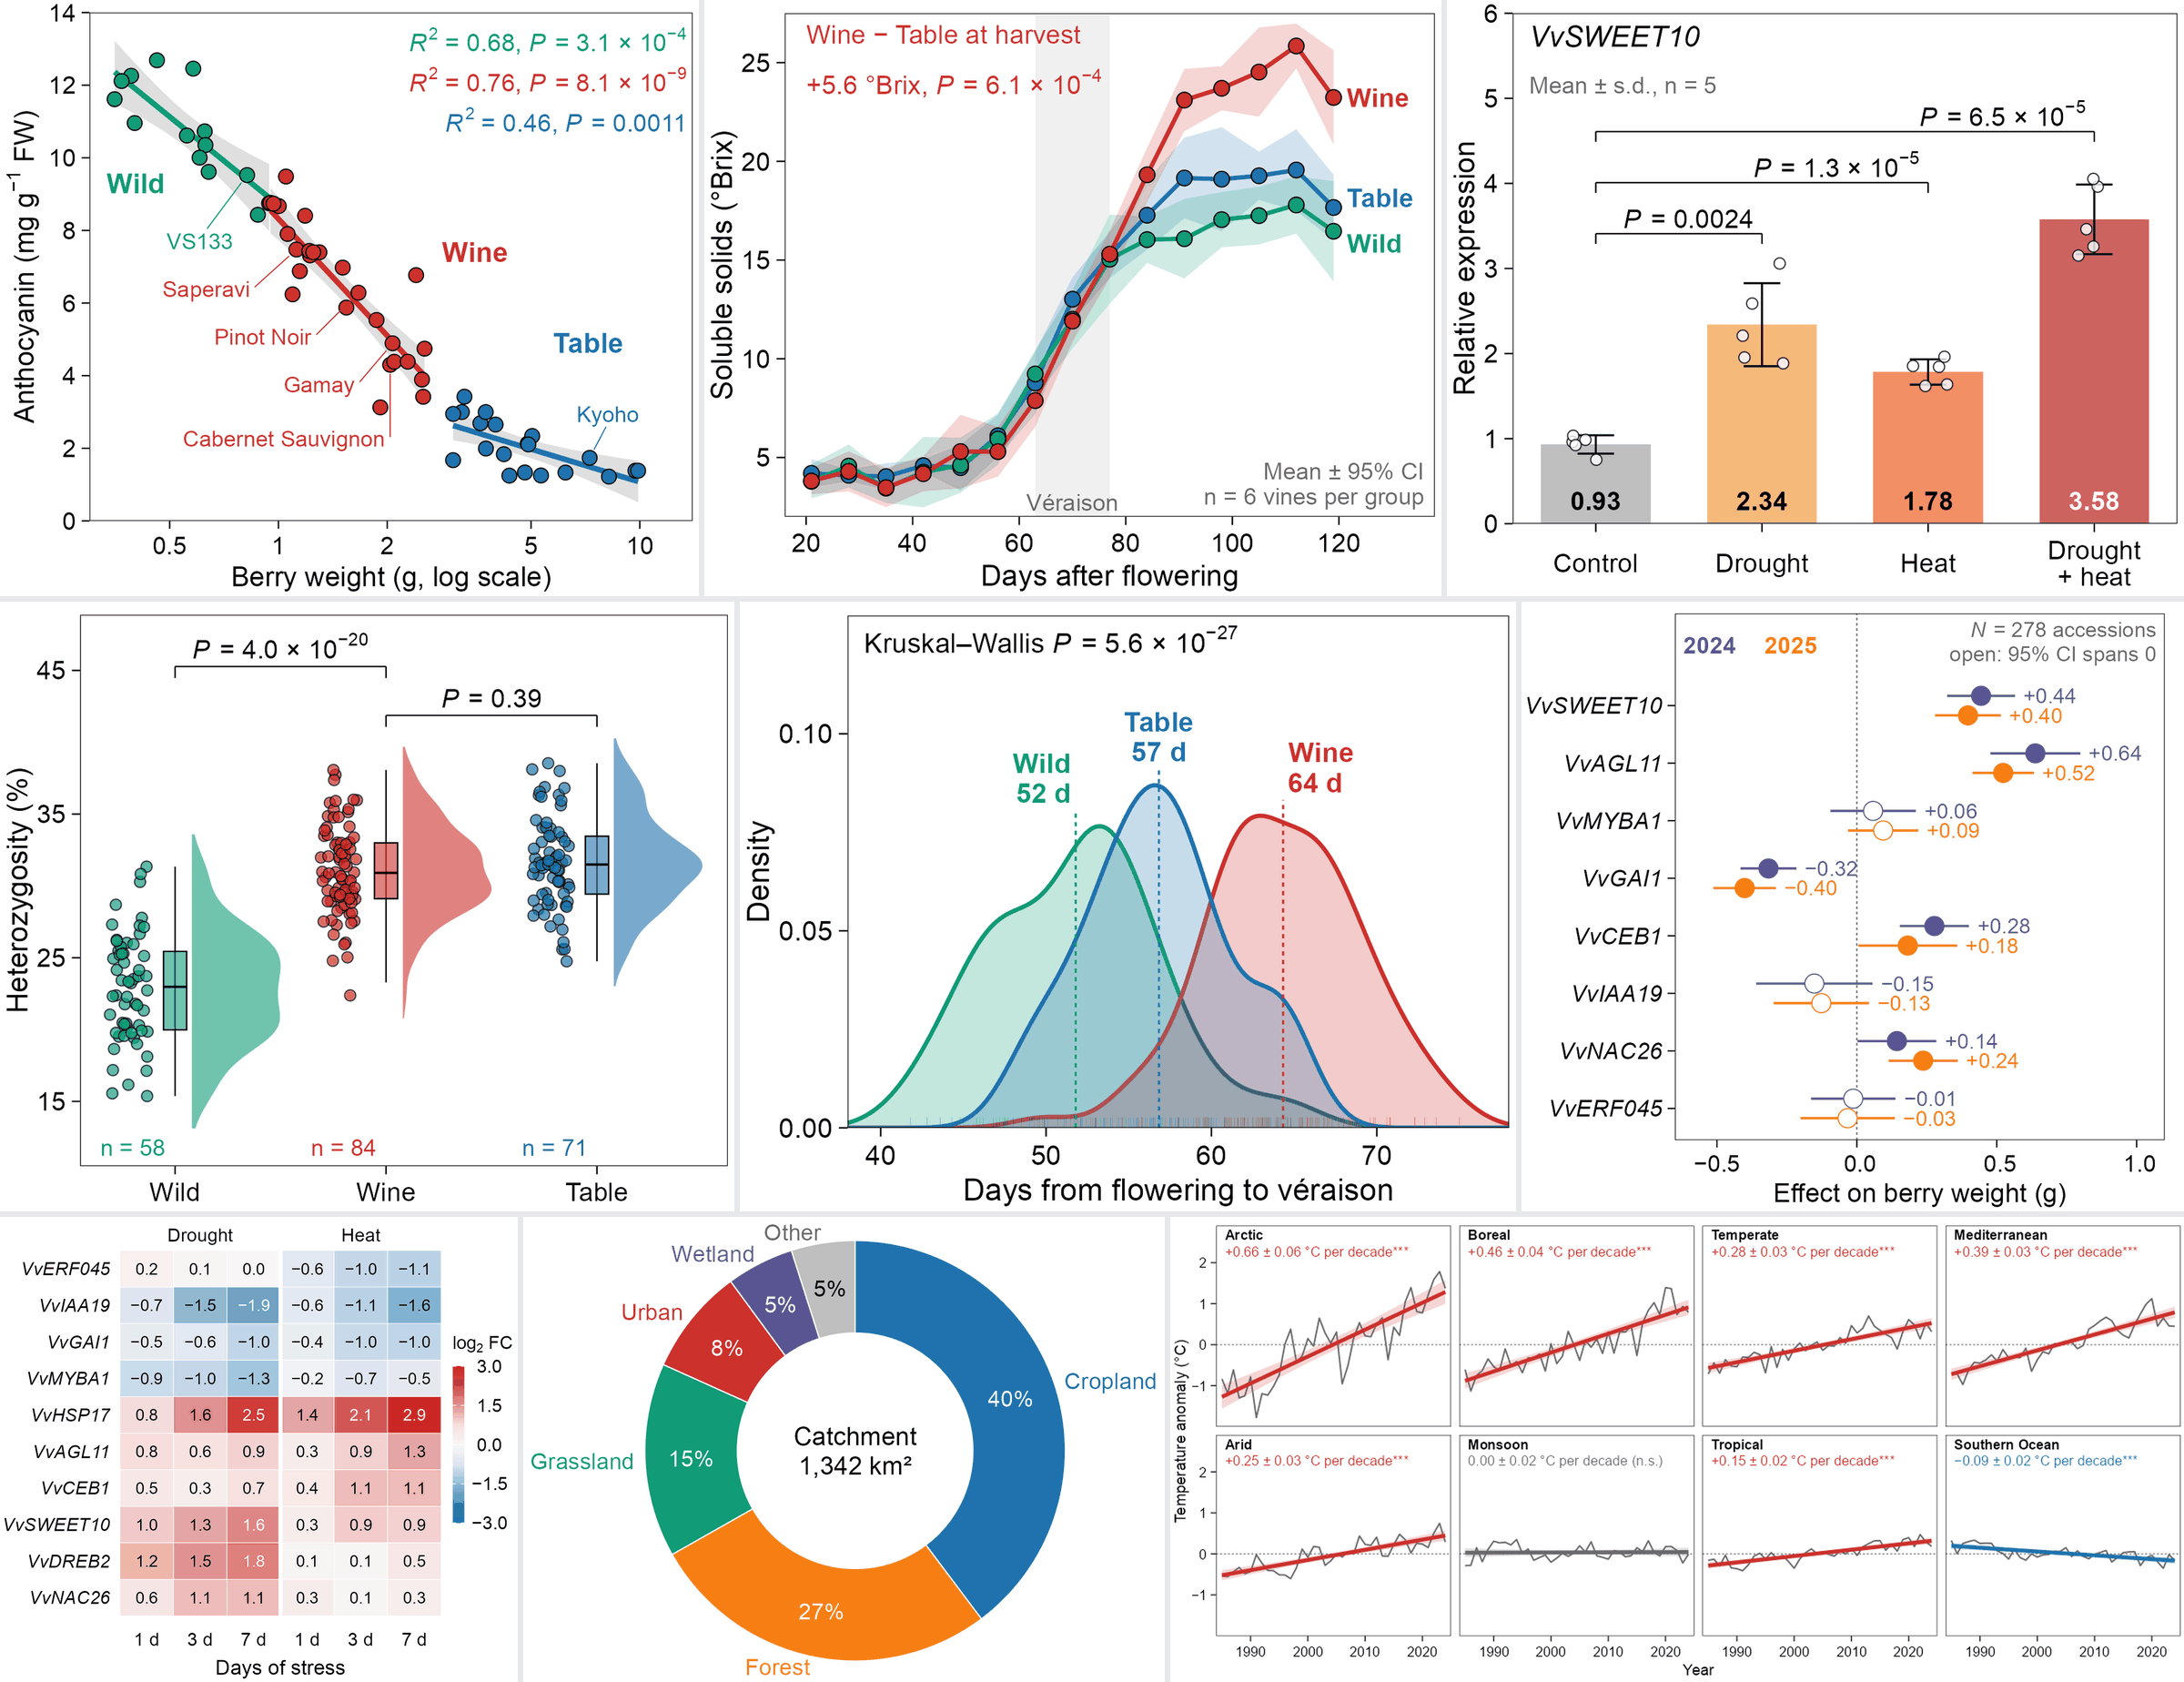
九张 house style 示例:分组散点与回归、带置信带的折线图、带原始点与 P 值的柱图、雨云图、分组密度曲线与均值、效应量森林图、带数值的发散色热图、直标环图、小多图与面板内趋势

用法 / How to use

  1. 在画廊找到图;
  2. 复制文件夹,按列名换上自己的数据;
  3. 运行 Rscript plot.R,得到矢量 PDF 和 600 dpi PNG。
  1. Find a chart below.
  2. Open its card and copy plot.R (or download plot.R and data.csv).
  3. Replace data.csv with your own data, keeping the columns listed on the card, and run Rscript plot.R to get a vector PDF and a 600 dpi PNG.

House style · 新图默认风格

图紧凑,字号不随面板缩小,留白少。规范页里有规范摘要、九张示例和示意图。

Compact panels, font size that does not shrink with the panel, little white space. The style page has the summary, the nine examples and the schematics.

打开规范页 / Open the style page

R 用法 / Usage

Schematics / 流程图

图库共有144张图。其中有123张数据图。figures/schematic/中有21个示意图模板。示意图有单独的画廊部分。它们被分开计算。每个模板文件夹包含template.drawio和figure.svg以及preview.png。这里没有数据文件。多数模板没有绘图脚本;selective-sweep-concept 另带 build.py,可重新生成上述文件。figure.svg中的文本是可编辑的矢量文本。文本不是图片。

The gallery has 144 figures in total. There are 123 data figures. There are 21 schematic templates in figures/schematic/. Schematics have their own gallery section. They are counted separately. Each template folder has template.drawio and figure.svg and preview.png. There is no data file. Most templates have no plot script; selective-sweep-concept also ships build.py, which regenerates these files. Text in figure.svg is editable vector text. Text is not pictures.

需要的列

data.csv 表头和前 5 行

可调参数

plot.R